
June 17, 2021
About curves tool
The curve tool is an editing tool that performs a transformation on the image by increasing or decreasing the lightness of the pixels. This means we have an INPUT image , that will be processed by the CURVES and will return an OUTPUT image. This tool is based on the information found in the histogram.
- Both CURVES and histogram are shown on the same graph.
- the y – axis now represents same information as x-axis (the tonal range of the pixels from 0 to 255),
- the y-axis represent the OUTPUT or the result of the CURVES function.
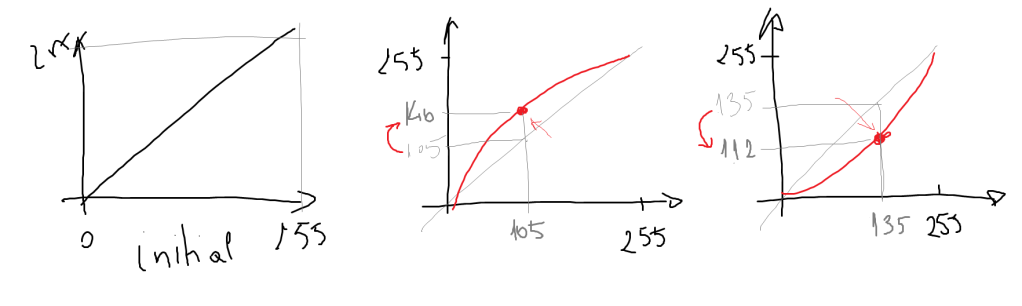
- Initially, a curve is a line at 45 degrees angle. This means that the initial tones on x-axis will output same tone values on y-axis.
Example: a tone value of 46 on x-axis, will have no modification performed, meaning value 46 on y-axis. - At the beginning, this “curve” is in fact a straight line because each tone on x-axis has same corresponding output tone on y-axis.
What modification can I perform with CURVES ?
Overexposure: with my mouse grabbing the CURVES line and pulling up. This operation it just says that for what ever pixel tone I can increase it’s value.
I will use a picture that has in total 50 pixels and is colored in gray. Could be a square picture or round or any shape but has 50 pixels in total. All pixels will be color gray, that is value 128. The histogram for this picture will be the picture above, showing a spike in the middle of height 50.
An overexposure of this picture means that the pixels that now have tone values at 128 will be increased digitally to whatever value I like. I could increase them to 150 or to 256 (pure white)
Below is an example of a normal curves function, an overexposure and a underexposure:

Overexposure will mean that the the pixels with initial tone of 128 will increase to tone value of 178. So pulling the curves up will mean that the spike will shift to the right.

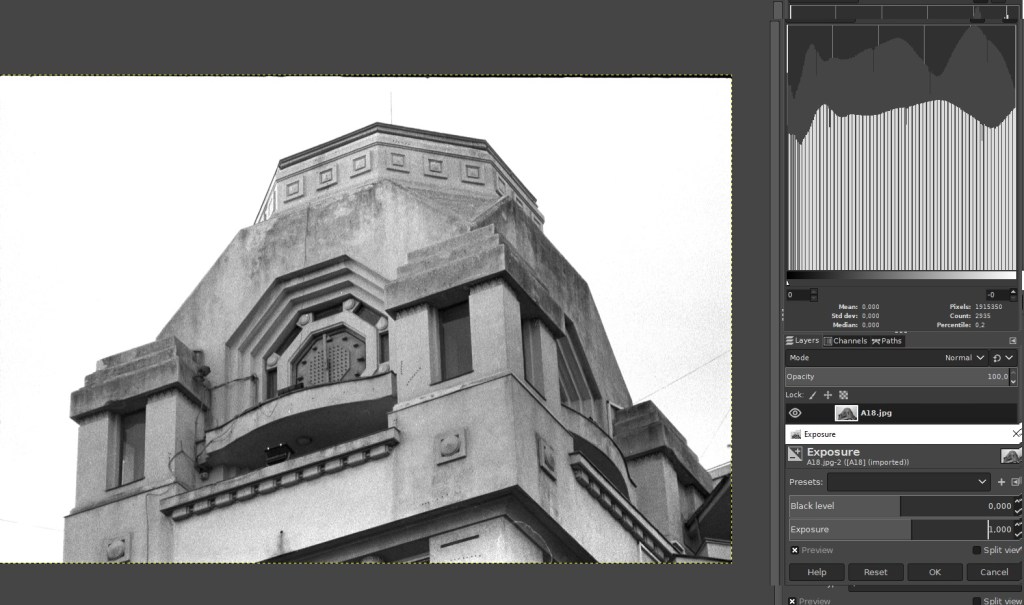
Below is an example of how the histogram will shift to the right, each step the exposure is increased, until is overexposed and loosing information of the whites color. You can see that the red column is already touching value 255, so increasing the exposure means that it will pass the range 255. Technically is not possible to pass value 255 because the microprocessor does not know a bigger value. This means that the pixels that were almost white, now will be white.
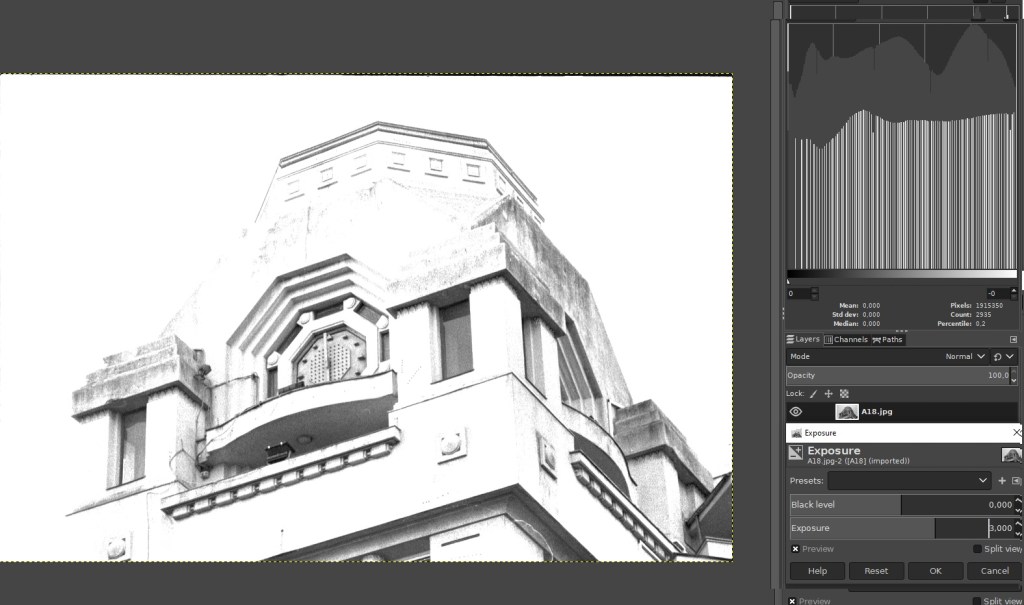
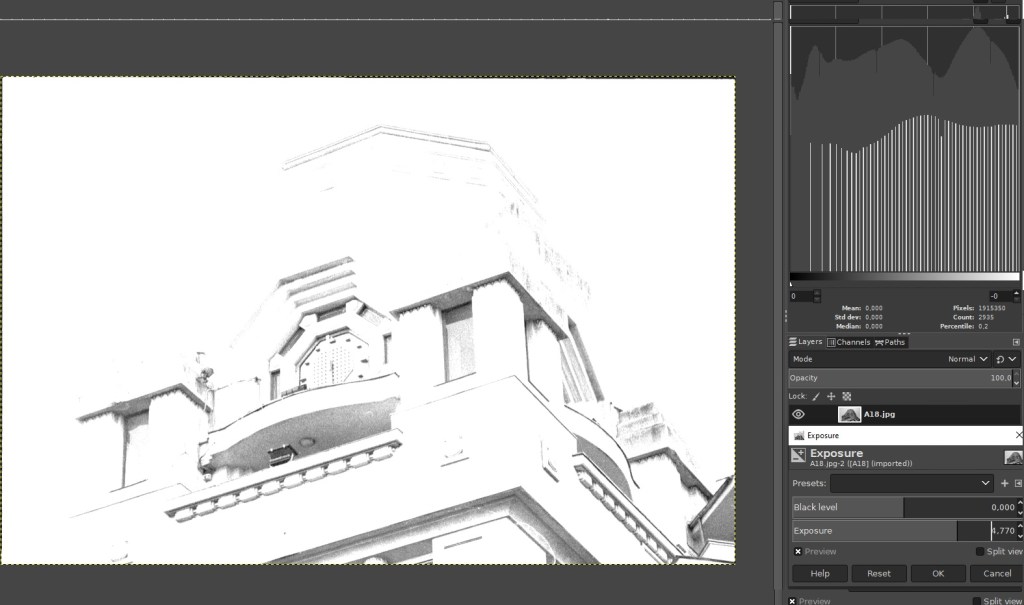
Of course now the orange column will be almost white. The black column of the extreme left will no longer be black, but a bit lighter. Increasing even a couple of steps further will mean that eventually all intermediate gray pixels will start to reach maximum value 255. So, more pixels will add to the already existing pure white pixels, having a picture with ever increasing white pixels. More and more pixels will get to be white until even the last column, from left, will be white and thus all the picture will be a big white picture.


Below is a tryout gif image where I wanted to depict the histogram as it shift to the right with Exposure increase. The histogram is on a logarithm scale.
Mentions about the curves function
Imagine having a histogram with separated column like above.
The CURVE function will perform transformation of overexposure or underexposure on all column when operating it. The reason for this is that whoever engineered the first editing programs, thought of a way how to do changes but incremental, in small steps in order to not ruin the result. So the CURVE is in fact a designed function in order to make fluid and mediated changes for all the columns. BUT these editing programs also have the ability to perform exact changes on the exact column that we want. This feature can be found as a “coarse curve”, and indeed is more difficult to work with and ruin the result, leading to big contrast zones within the photo.
In “coarse” mode, I have the ability to manipulate exactly one column, moving it where ever I want, even passing other column, to the right or to the left. So for example all black pixels in an image I can make them pure white, leaving all the other pixels unmodified.
Please check also the post about HISTOGRAM to have the hole picture of the concept: https://thephotonmemories.com/2021/06/17/histogram/

Leave a comment